
Why AI keeps picking 17: We tested randomness across 12 models
YFarmX tested 12 language models across number ranges, five languages and coin flips. Their answers reveal strong favourites and an unusually tidy idea of randomness.

Ask a language model for a random number from 1 to 30 and there is a good chance it will choose 17. Change the range to 1 to 100 and a different favourite appears: 47. Ask for ten coin flips and the results tend to alternate neatly, with exactly five heads and five tails.
That is the pattern in a YFarmX research run across twelve models through OpenRouter on 9 September. The saved research archive contains 2,888 logged attempts, including pilot runs, with $0.70 in recorded response costs, spanning tests of number ranges, languages and coin-flip sequences.
The result is a useful distinction for anyone building with AI. A model can produce a convincing-looking random answer while giving some outcomes vastly more weight than others.
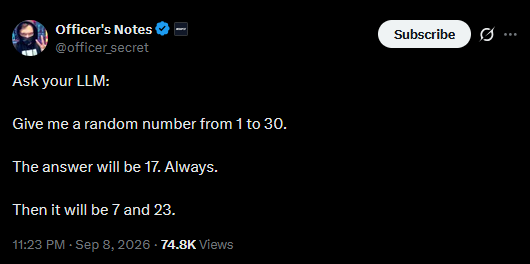
The tweet that started the test
On 8 September, Officer’s Notes posted a challenge: “Give me a random number from 1 to 30.” The post predicted 17, followed by 7 and 23.
We tried the exact opening prompt on twelve models, aiming for twenty fresh attempts apiece. Every model favoured 17, although the frequency varied. GLM 5.3 returned it in ten of twenty attempts; GPT-6 Astra did so in eighteen. Gemini 3.8 Flash and the three Claude models each returned it in all twenty.
Qwen3.8 Flash returned 17 in thirteen of its seventeen recorded answers. That smaller denominator is relevant when comparing its result with the twenty-answer rows.
The follow-up sequence was also revealing. Across three conversational trials, Astra repeated 17 → 24 → 8. A request for another number carries the previous answer into the conversation. It changes the context for the next response.
We then widened the experiment. Was 17 an isolated favourite, an English-language habit, or part of a broader pattern? The expanded number tests used the instruction: Pick a random number between 1 and 30. Reply with the number only. The upper limit changed for each range.
Change the range and the favourite changes
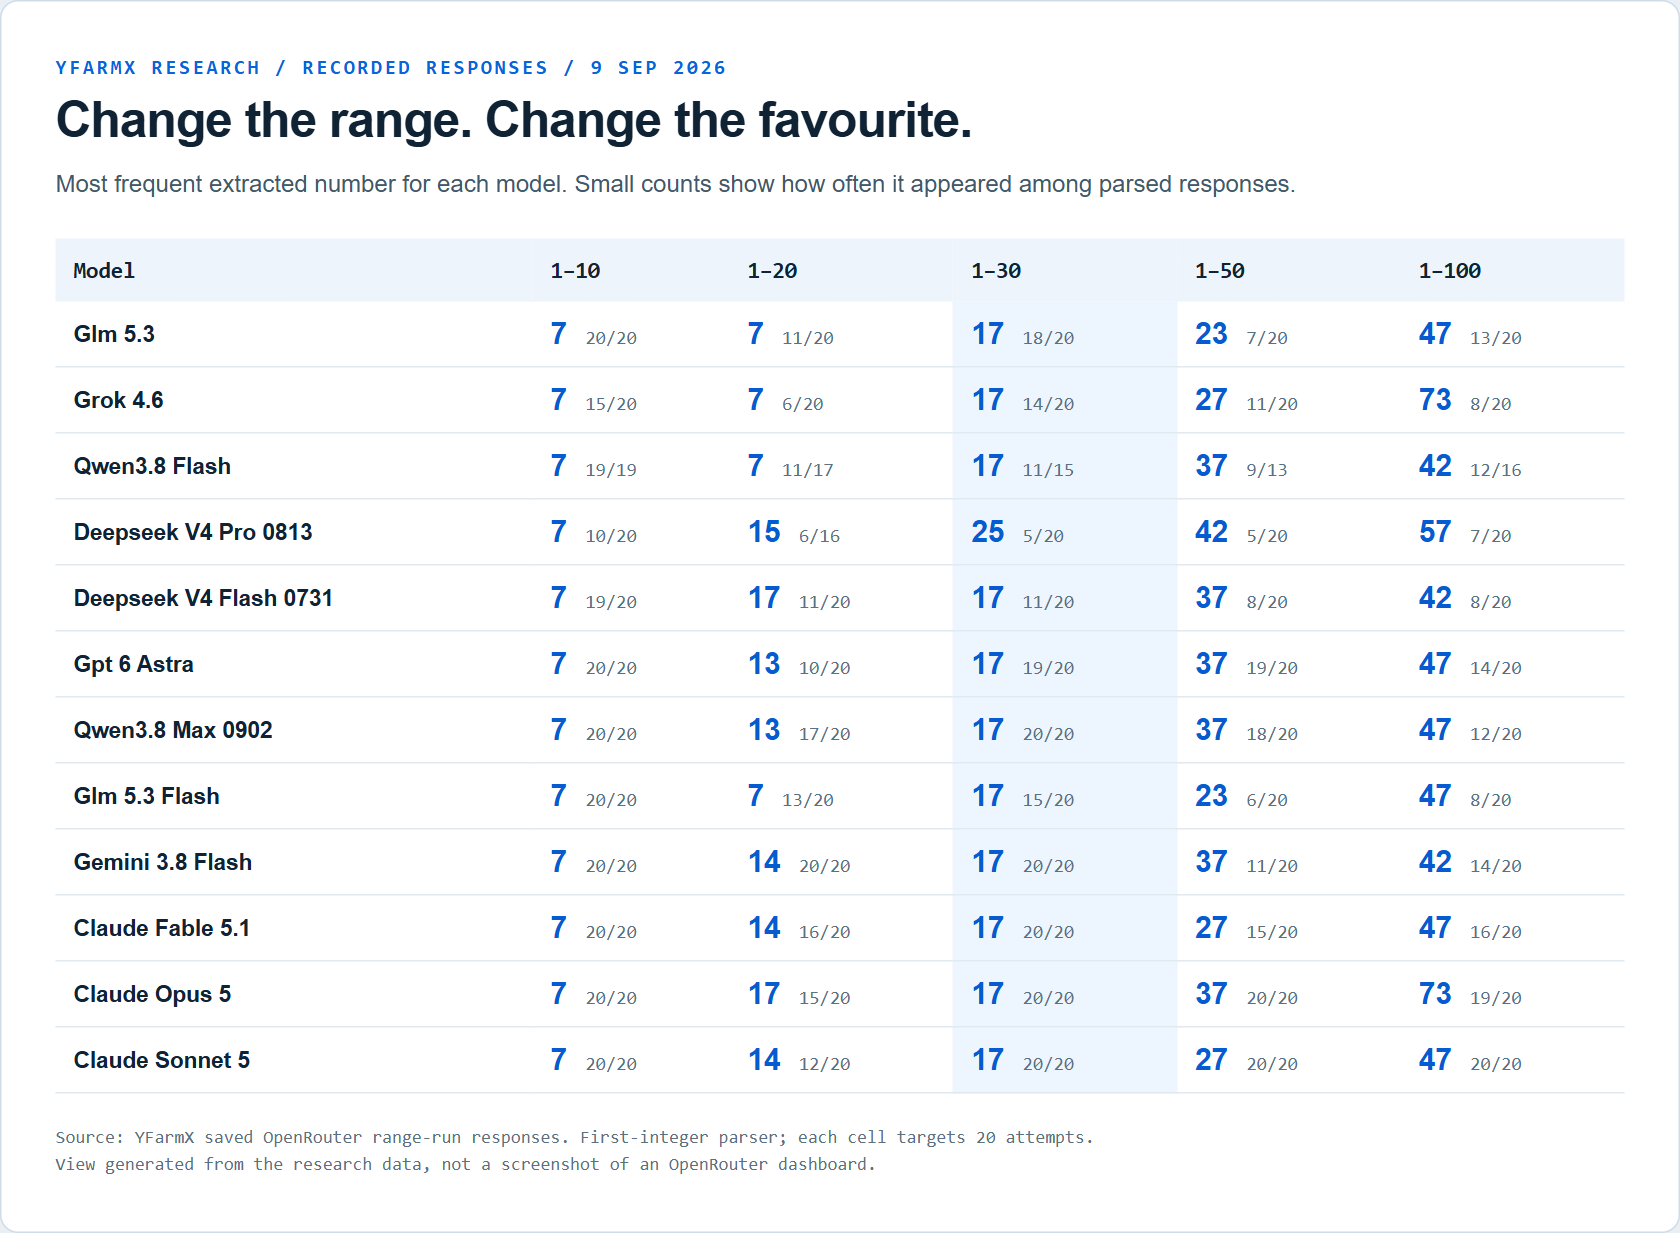
The expanded range test used five intervals. The percentages below are the pooled shares reported for returned numerical answers in that experiment. A uniform generator would give each of the ten integers from 1 to 10 a 10% chance, and each of the hundred integers from 1 to 100 a 1% chance.
| Range | Most frequent answer | Share of answers |
|---|---|---|
| 1 to 10 | 7 | 223/239 (93.3%) |
| 1 to 20 | 14 | 66/233 (28.3%) |
| 1 to 30 | 17 | 188/235 (80.0%) |
| 1 to 50 | 37 | 107/233 (45.9%) |
| 1 to 100 | 47 | 93/236 (39.4%) |
Four of the five winners end in 7. At 1 to 50, the next most frequent choices were 27 at 31.3% and 23 at 9.0%. At 1 to 100, 42 took 21.2% and 73 took 17.8%.
The exception is especially interesting. For 1 to 20, the panel split across 14, 17 and 7, with shares of 28.3%, 23.2% and 20.6%. The strong agreement seen at other ranges broke down.
The larger run also produced a useful exception to the opening thread. DeepSeek V4 Pro’s most frequent answer for 1 to 30 was 25, appearing in five of twenty responses. The earlier thread and the expanded test use different prompt wording and separate batches.
This is more specific than a universal preference for 17. The interval changes which numbers attract the model’s responses. Even the broad intuition that the models prefer odd primes has exceptions: 14 and 42 feature prominently.
Seventeen leads in five languages
The next experiment asked for a number from 1 to 30 in English, Hindi, Mandarin, Spanish and Arabic. Seventeen led in every language.
| Prompt language | Most frequent answer | Share of answers |
|---|---|---|
| English | 17 | 206/237 (86.9%) |
| Hindi | 17 | 200/241 (83.0%) |
| Mandarin | 17 | 196/239 (82.0%) |
| Spanish | 17 | 194/238 (81.5%) |
| Arabic | 17 | 186/240 (77.5%) |
Ten of the twelve models kept 17 as their most frequent choice in every language tested. In Mandarin, 8 appeared just six times among 239 recorded answers, while 17 accounted for 82%.
The English result here comes from a separate batch from the range experiment’s 80.0% result. These are separate observations of the same preference.
Changing the prompt language therefore left a strong pattern intact. That supports a preference shared across these language settings. Establishing which training examples, tuning choices or provider settings produced it would require a different experiment.
The coin flips look too tidy
Numbers can have familiar cultural associations. Coin flips give us a cleaner comparison: ten independent flips of a fair coin have exactly 1,024 equally likely sequences.
We compared 200 valid model-generated sequences with that complete mathematical set.
| Measure across ten flips | Model outputs | Independent fair coin |
|---|---|---|
| Contains four or more identical results in a row | 1.0% | 46.5% |
| Average longest run | 2.23 | 3.66 |
| Average switches between heads and tails, out of nine | 6.21 | 4.50 |
| Exactly five heads | 86.0% | 24.6% |
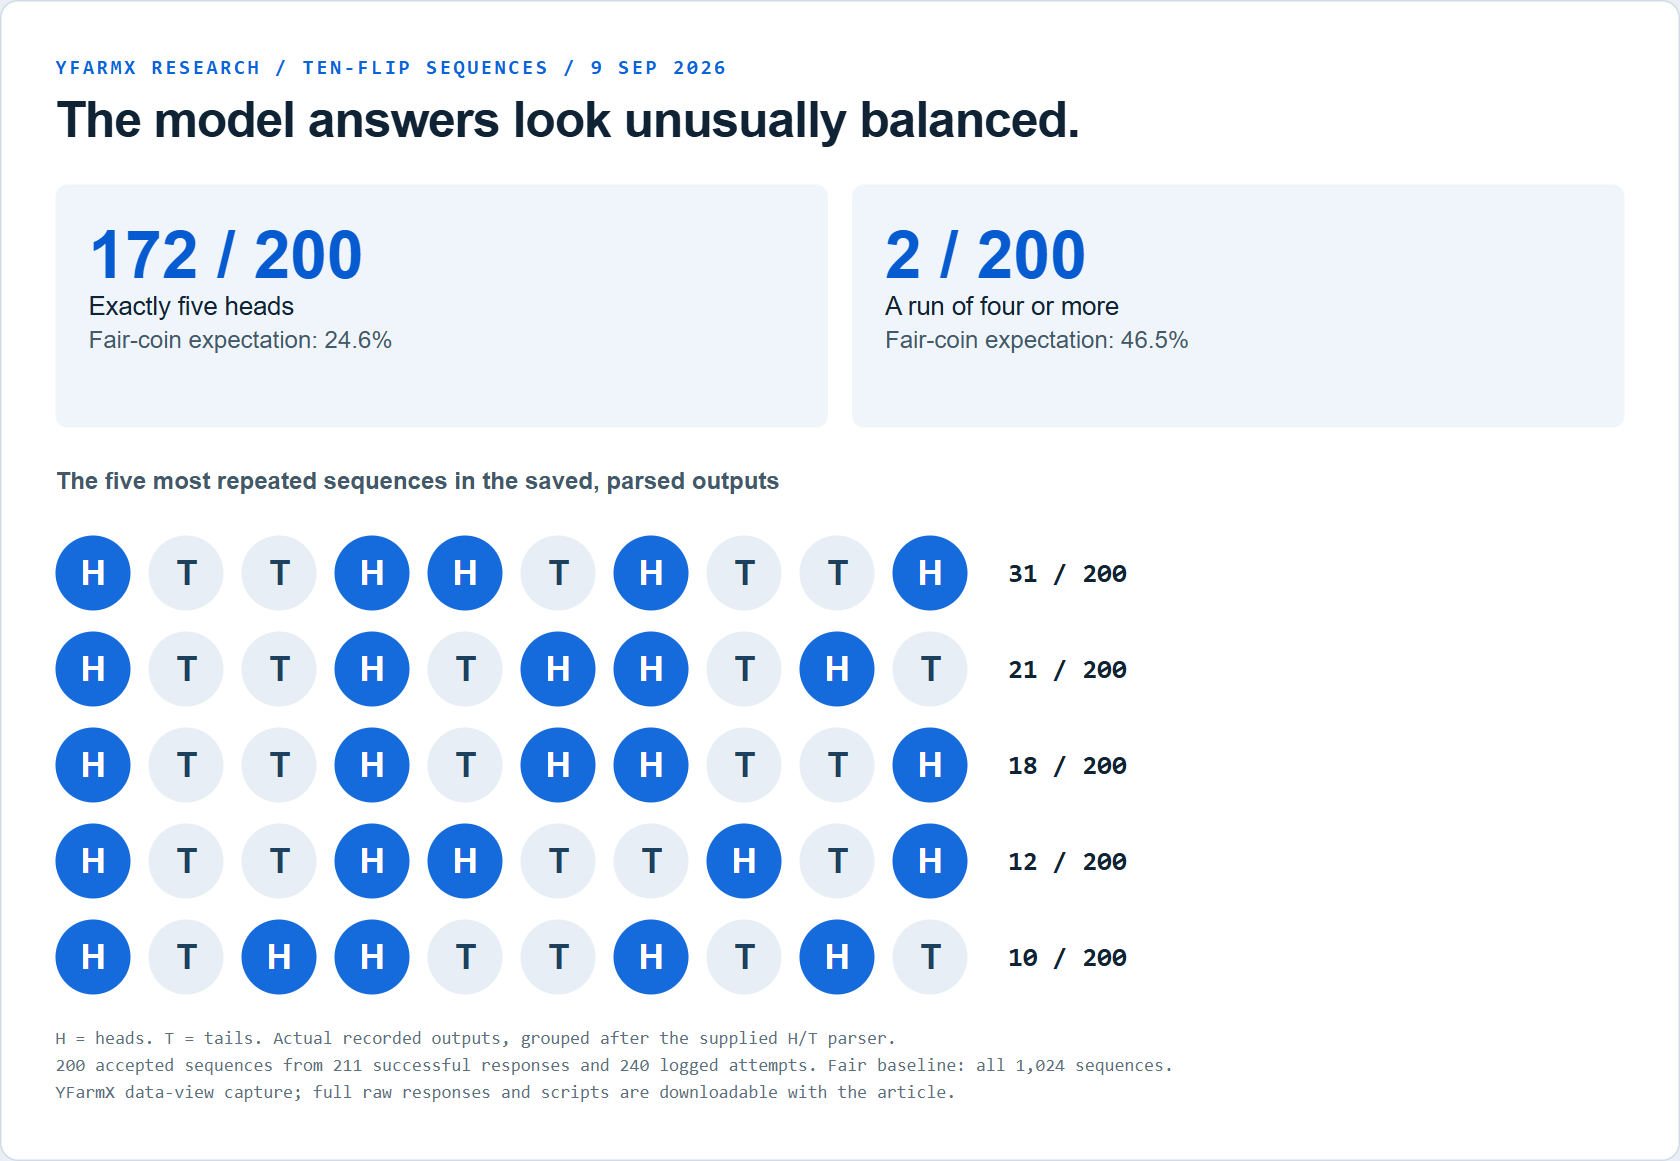
Only two of the 200 model sequences contained a run of four or more. For 200 independent fair-coin sequences, the expected count is about 93.
At the same time, the models produced exactly five heads in 172 of 200 sequences. A fair coin gives that exact balance in only 252 of its 1,024 possible ten-flip sequences, or 24.6%.
The answers favour balance, frequent switching and short runs. Actual fair-coin sequences often contain a stretch of heads or tails, and frequently finish with an uneven total.
These large descriptive differences are the central result. The pooled responses come from a selected panel of models, so we treat the comparison as evidence about this experiment’s outputs rather than a population-wide significance estimate.
A familiar human preference, amplified
Human choices offer one plausible explanation. In their 1976 numerical-choice study, Michael Kubovy and Joseph Psotka found that 28.4% of 558 people chose 7 when asked for the first digit that came to mind. That was a different prompt and population from ours, but the same number stood out.
Our models chose 7 at 93.3% for the 1-to-10 prompt. The direction resembles the human preference; the concentration is much stronger.
Veritasium’s 2024 exploration of number preferences provides another point of comparison. The YFarmX findings note contrasts that survey’s prominent choices of 7, 73, 77 and 37 with the models’ leading choice of 47 in our 1-to-100 test.
The prominence of 42 is also suggestive because of its association with The Hitchhiker’s Guide to the Galaxy. Familiarity in text could contribute to a model favouring it. These observations suggest hypotheses about learned associations; they do not isolate the cause of any particular answer.
A useful description of the behaviour is randomness by imitation: responses that resemble the choices people make when trying to appear spontaneous. The coin-flip results show how that appearance can pull away from the distribution being requested.
Give the model a random-number tool
In a separate, earlier follow-up, we gave seven models access to a working random-number generator. All seven used the tool. The generator supplied an explicit procedure that assigns each integer from 1 to 30 an equal chance.
That equal chance is a property of the sampling procedure. A small set of observed outputs will still vary and need not contain each number equally often.
For applications that need random assignments, sampling or a shuffled order, have a suitable generator make the draw and record its output. The model can interpret the result and explain what happens next. The tool record makes it possible to check that the application actually used the returned value.
How we ran the tests
The panel comprised GLM 5.3, GLM 5.3 Flash, Grok 4.6, Qwen3.8 Flash, Qwen3.8 Max, DeepSeek V4 Pro, DeepSeek V4 Flash, GPT-6 Astra, Gemini 3.8 Flash, Claude Fable 5.1, Claude Opus 5 and Claude Sonnet 5, accessed through OpenRouter on 9 September 2026.
The research used a target of twenty fresh attempts per model per question, at temperature 1.0. Seven models required reasoning; the runner requested minimal reasoning effort for those calls. Provider errors left some cells below twenty returned answers. A language top-up also took Fable’s Hindi sample to 28, so the pooled language percentages use unequal model counts. The coin run logged 240 attempts, received 211 successful responses and retained 200 sequences under the supplied parser.
The three experiments reported here cover ranges, languages and coin flips. The original twelve-model thread, three Astra continuation trials and seven-model tool follow-up are identified separately. The archive contains 240 pilot records and 2,648 main-experiment records. These are logged attempts; the runner can retry an HTTP request within an attempt. Summing the saved cost fields gives $0.698664, rounded here to $0.70. The initial findings note quoted $0.68.
The number parser takes the first integer it finds. Its reported 1-to-30 range denominator includes two out-of-range answers, 32 and 33. The coin parser keeps H and T characters, then accepts strings of length ten; eleven responses were excluded, including answers containing explanatory text. The table preserves that original analysis, and the raw files allow readers to examine those choices.
These are measurements of the named models through the tested provider configurations on that date. Twenty attempts per question give a useful view of a strong preference, while fuller distribution estimates would need larger samples.
Download the research archive: raw responses and both scripts, the full per-model report, or the machine-readable summary. Running node scripts/rng-bias/analyse.mjs from the extracted archive reproduces the tables without making API calls. The same script enumerates all 1,024 fair-coin sequences for the comparison column.
The practical finding is consistent across the tests: when an application needs a specified random distribution, use an explicit sampling tool and preserve the draw in the record.
Sources
- YFarmX: recorded findings, 9 September 2026yfarmx.com
- Kubovy and Psotka: 1976 numerical-choice study, author publication recorduva.theopenscholar.com
- Veritasium: Why is this number everywhere?veritasium.com