
Robotaxis and self-driving
the largest robot fleet on earth
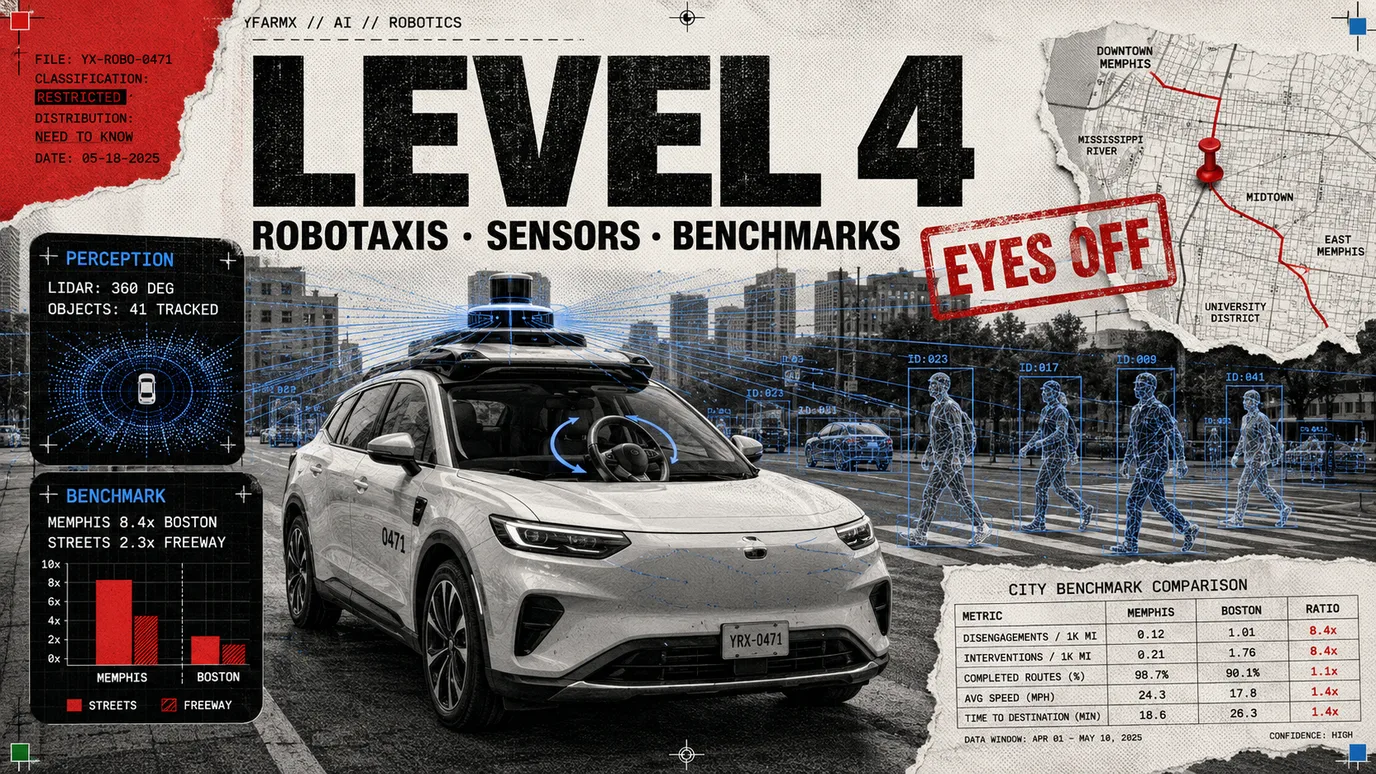
Key facts
- 0–5SAE J3016
- Levels
- 127 mautonomous miles
- Waymo study
- 8.4×Memphis vs Boston
- City spread
- 2.3×fatal crash rate
- Streets vs freeway
Cars that drive themselves within a defined area, and the argument about how you prove they are safer than the people they replace.
Self-driving vehicles are the largest deployment of embodied AI in the world, by orders of magnitude. They are also the only part of robotics with a mature public argument about how safety should be proved, which makes them the useful case study for everything else.
The levels, and the one that counts
The SAE J3016 scale runs from 0 to 5 and is quoted constantly, usually wrongly.
- Level 0 to 2 are driver support. Adaptive cruise, lane keeping, and the combined systems sold under confident brand names are all level 2. The person is driving. The system is helping. If it fails, that is the driver’s problem.
- Level 3 is conditional automation: the car drives, the person may look away, and the car will ask them to take back control with enough warning. Legally awkward and rare.
- Level 4 is the one that produces a robotaxi. The car drives itself inside a defined operational design domain, an area and set of conditions it is approved for, and needs no fallback from a human inside that domain. Outside it, it does not operate at all.
- Level 5 is anywhere, any conditions, no limits. Nothing on the road is level 5, and nothing is close.
The jump from 2 to 4 is not incremental. A level 2 system may hand back control at any moment; a level 4 system may not, which means it has to handle every failure itself, including its own sensor faults.
The sensor argument
Two philosophies, both with real arguments.
Cameras only. Vision is what humans use, cameras are cheap, and a model trained on enough video will learn to infer depth and intent. The advantage is cost and fleet scale. The weakness is that a camera is a passive sensor and can be defeated by sun glare, spray and darkness, and monocular depth is inference rather than measurement.
Sensor fusion. Cameras plus radar plus lidar, which measures distance directly with light. Redundancy across sensing types means a failure mode in one is usually covered by another. The weakness is cost, complexity and the engineering of disagreement: when the lidar and the camera report different worlds, something has to decide.
The dispute is not really about physics. It is about whether a fleet gets cheap enough to scale before it gets safe enough to deploy.
How safety gets measured, and why the benchmark is the argument
The natural instinct is to count miles. It is close to meaningless on its own, because miles are not comparable.
The same fleet, judged against three different benchmarks
Two peer-reviewed studies published by Waymo in July 2026 put figures on how wide the spread is. On surface streets, human drivers in Memphis were involved in fatal crashes at 8.4 times the rate of drivers in Boston. Across the 50 largest US urban areas, surface streets carried 2.3 times the fatal crash rate of freeways. Between midnight and 03:59, human crash rates ran 2 to 5 times the general average on weekdays and 2.5 to 6 times at weekends, in hours that make up 1.5 per cent of total human mileage.
Against 127 million autonomous miles, matched for city, day and hour, Waymo put its own record at 359 fewer injury crashes, with 53 per cent of those avoided between 20:00 and 03:59.
The caveat is that the company being measured built the yardstick. Peer review covers the method rather than any regulator’s endorsement of the verdict, and a benchmark this sensitive can flatter an easy record as readily as it credits a hard one.
What still goes wrong
The remaining failures are not the ones people expect. Ordinary driving is handled. What causes trouble is the unusual and the social: temporary roadworks with hand-signalling, an emergency vehicle behaving unpredictably, a police officer waving a car through a red light, snow covering the lane markings, or a situation where the safe move is to break a rule.
Then there is the negotiation problem. Human drivers communicate through small movements, a nudge forward at a junction, eye contact at a crossing. A vehicle that follows the rules exactly can freeze in traffic that expects it to assert itself, and a vehicle that asserts itself is a vehicle taking risk on purpose.
Where it is deployed
Every deployed system is level 4 inside a defined domain, city by city, with mapping, testing and a regulatory approval per area. That is why expansion is announced one metro at a time rather than as a software update, and why “self-driving” in a consumer car sold today means level 2 with a person responsible.
For how these vehicles see and place themselves, read machine vision and SLAM.
More AI
All AI →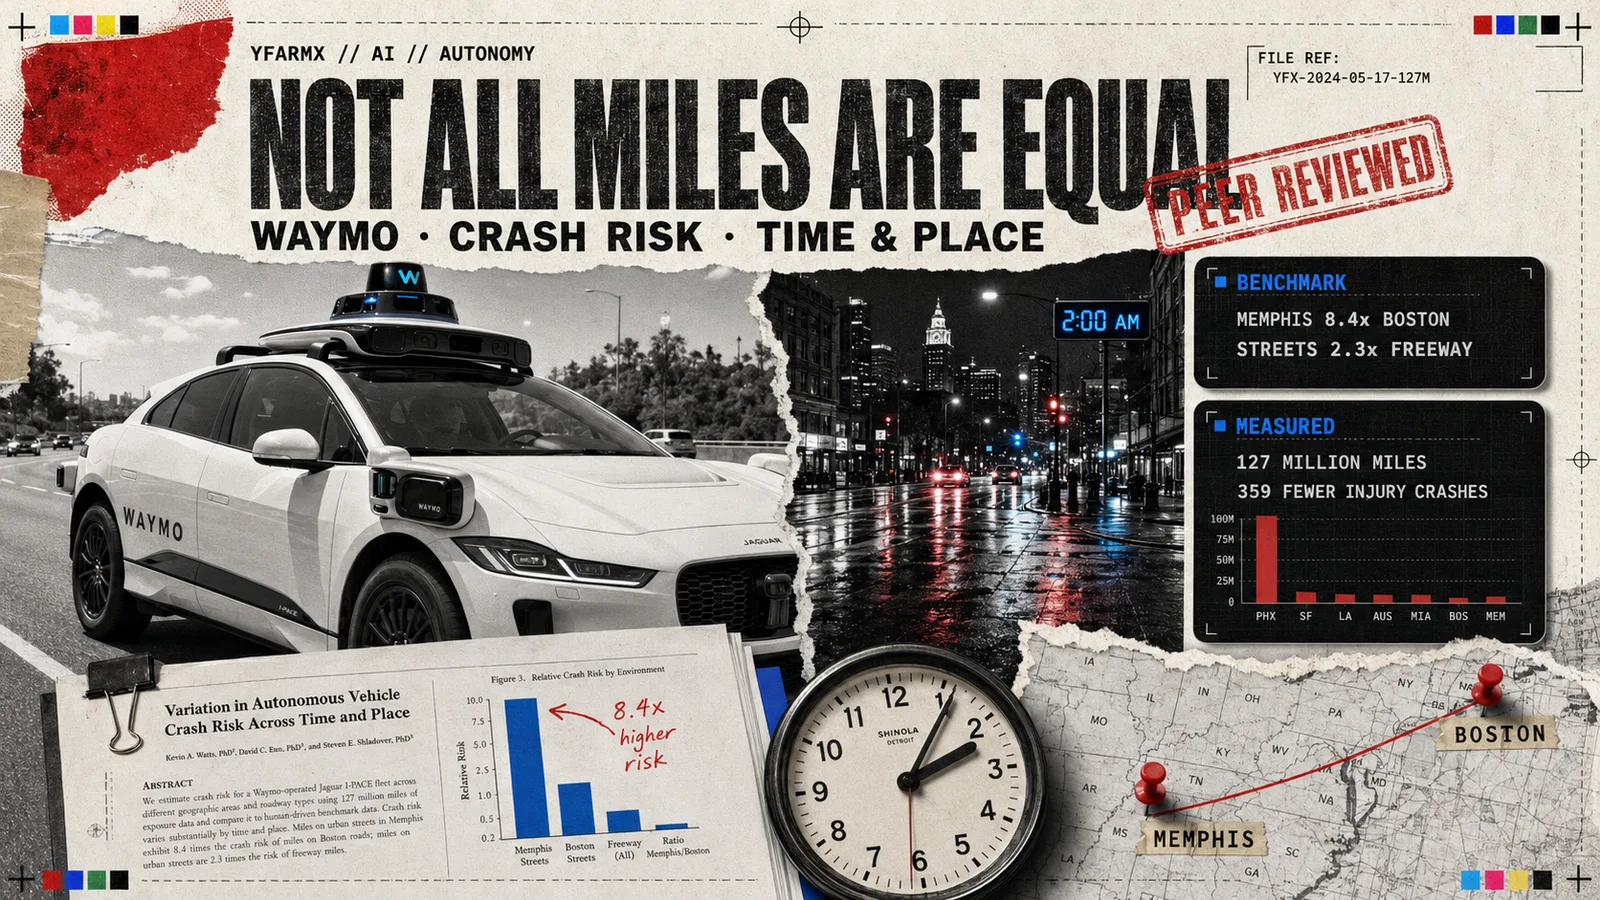
Waymo puts numbers on where and when human driving turns dangerous
Two peer-reviewed studies from Waymo map human fatal crash risk by city, road type and hour of the day, and find the single national average that self-driving safety claims lean on hides both the safest and the most dangerous driving in America.
More in Robotics
All Robotics →- Machine vision and SLAMhow a robot knows where it is
- Embodied AIintelligence with something to lose
- Robot safety standardsthe rules that decide what can be sold
- Humanoid robotsthe human template, and why every lab is copying it
- Robot foundation modelsone brain, many bodies
- Industrial robots and cobotsthe five million machines already at work