
Waymo puts numbers on where and when human driving turns dangerous
Two peer-reviewed studies from Waymo map human fatal crash risk by city, road type and hour of the day, and find the single national average that self-driving safety claims lean on hides both the safest and the most dangerous driving in America.
Listen to this articleListen
Every claim made about self-driving safety rests on a comparison, and the comparison is usually a national average. On 7 July Waymo published two studies, both peer-reviewed and accepted by the journal Traffic Injury Prevention, arguing that the average is the wrong yardstick and showing by how much.
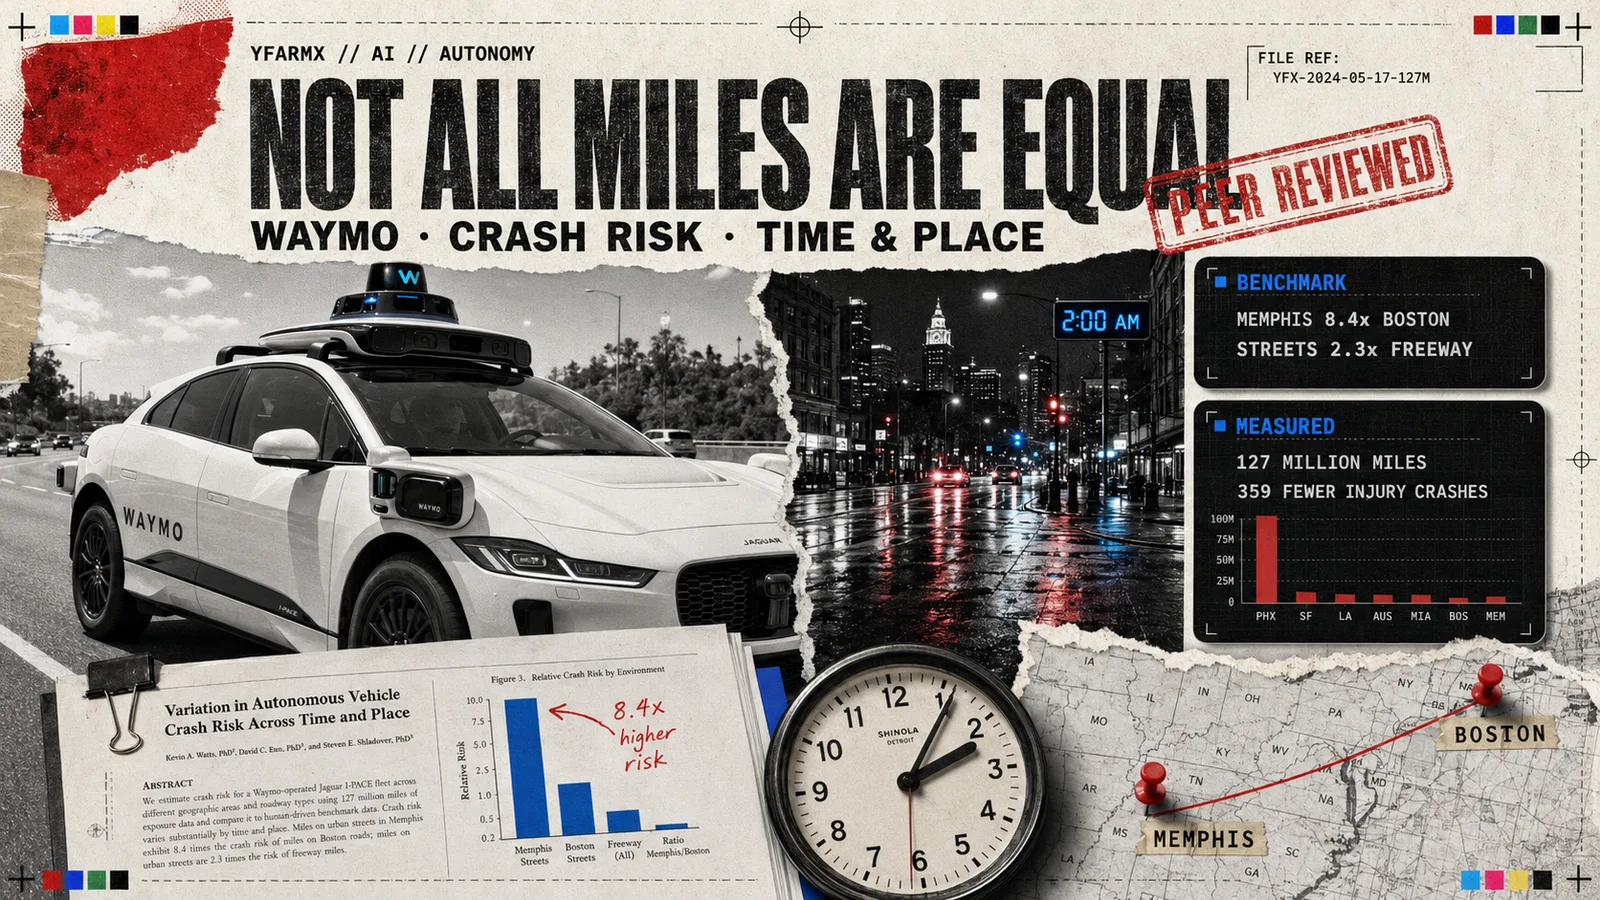
The finding at the centre of the work is the spread. Across the 50 most populous urban areas in the United States, human drivers in Memphis were involved in fatal crashes on surface streets at a rate 8.4 times that of drivers in Boston. Waymo’s own reading of what a single national figure does to those two cities is unusually direct: it overstates the risk of driving in Boston by three times, and understates the hazard in Memphis by the same margin.
The road under the wheels
Road type does nearly as much work as geography. Across all 50 regions, driving on surface streets carries a fatal crash rate 2.3 times higher than driving on freeways. Motorway miles are the easy ones: no crossing traffic, no pedestrians stepping out, no cyclists, no left turns across a junction. A fleet that runs its miles on city streets is doing the hard version of the job, and a fleet that runs them on freeways is not.
This is the practical problem with mileage totals as a safety currency. Two companies can both announce ten million autonomous miles and have done entirely different things with them.
The hour on the clock
The second study goes further and breaks risk down by hour of day and day of week across Waymo’s larger operating areas: Maricopa County, San Francisco, Los Angeles and Travis County. Between midnight and 03:59 human crash rates run 2 to 5 times the general average on weekdays, and 2.5 to 6 times at weekends.
Those hours are almost invisible in ordinary crash statistics because they account for just 1.5 per cent of human mileage. The daytime commute is such a large share of the total that it flattens the late-night peak out of the average entirely.
Feng Guo, professor of statistics at Virginia Tech and lead data scientist at the Virginia Tech Transportation Institute, put the methodological point this way: “Evaluating autonomous vehicle safety requires moving past abstract, aggregated national averages. Meaningful safety assessment must be context-specific, accounting for the disparities in risk across different regions, infrastructure types, and times of day.”
What it says about Waymo’s own record
Waymo has an obvious interest here, and the interest runs in a specific direction. As a ride-hailing service it works hardest when people are going out and coming home: its fleet covers four times the proportion of overnight miles that an average human driver does. Measured against a flat national benchmark, that late-night concentration counts against it. Measured against a benchmark matched for time and place, it counts for it.
Against 127 million fully autonomous miles, compared with a human driver covering the same mix of cities, days and hours, the study puts Waymo at 359 fewer injury crashes. Of those avoided crashes, 189, or 53 per cent, fall between 20:00 and 03:59. Roughly half of the measured benefit comes from eight hours of the day.
Jonathan Adkins, chief executive of the Governors Highway Safety Association, described the underlying pattern from the road-safety side: “The data points to a significant increase in crash risk during late-night and weekend hours, when road safety is most unpredictable and impaired driving is most prevalent.”
Where the method still runs out
Fatal crashes are too rare to compare directly at current autonomous mileage. Waymo says as much: the fatal-crash baselines in the first paper are built now so that a comparison becomes possible later, once the miles accumulate. The injury-crash comparison is the one carrying weight today, and the fatal-crash work is groundwork.
The other limit is ownership of the yardstick. These benchmarks were built by the company being measured, and published by it, with the peer review sitting on the method rather than on any regulator’s approval of the result. Waymo has released the methodology and invited the rest of the field to adopt it, which is the right instinct; whether a shared standard emerges depends on whether anyone else adopts it, and on whether the regulators writing the rules for autonomous systems treat a time-and-place-matched benchmark as the reference or as one company’s preferred framing.
A better yardstick cuts both ways
The interesting consequence is not the one Waymo leads with. If crash risk is this sensitive to city, street type and hour, then a benchmark honest enough to credit a fleet for hard miles is equally capable of exposing an easy record. A company running daylight freeway miles in a low-risk metro area under a national average looks safer than it is, and the same maths that flatters Waymo’s overnight work would say so.
Read the explainer on robotaxis and self-driving stacks for how these systems are built, and how the industry counts what they do.
Sources
- Waymo, Not All Miles are Equal (7 July 2026)waymo.com
- Traffic Injury Prevention (Taylor & Francis)tandfonline.com
- Virginia Tech Transportation Institutevtti.vt.edu
- Governors Highway Safety Associationghsa.org